The property is a newly constructed indoor entertainment center located in eastern Massachusetts that was placed in service in 2019 at a cost of $16,056,000. The two-story, 125,000 square-foot facility includes two indoor kart tracks, a restaurant, gaming center, driver sign-in area, trampoline center, ninja course, party rooms and a large viewing mezzanine overlooking the kart tracks.
Unique Challenges/Benefits
Detailed construction invoices are the key to maximizing the value of a cost segregation study. However, contractors usually do not break down their costs to the level of detail (as outlined by the IRS) that is fully advantageous to an owner. Using IRS-preferred methodologies and pricing sources, skilled CRS engineers were able to estimate the cost of various building systems and assets not typically found within standard construction invoices.
Elements of the property unique to entertainment centers generated a larger than usual amount of assets able to be reallocated to shorter personal property depreciation periods.
Before Cost Segregation
If the client had not performed a cost segregation study, 100% of the building assets would have been treated as standard “real property” using a “straight-line” method would only have generated first-year depreciation of $223,334.
After Cost Segregation
CRS reallocated a significant amount of the building assets to shorter depreciation periods, resulting in the following accelerated tax benefits and cash flow for the client.
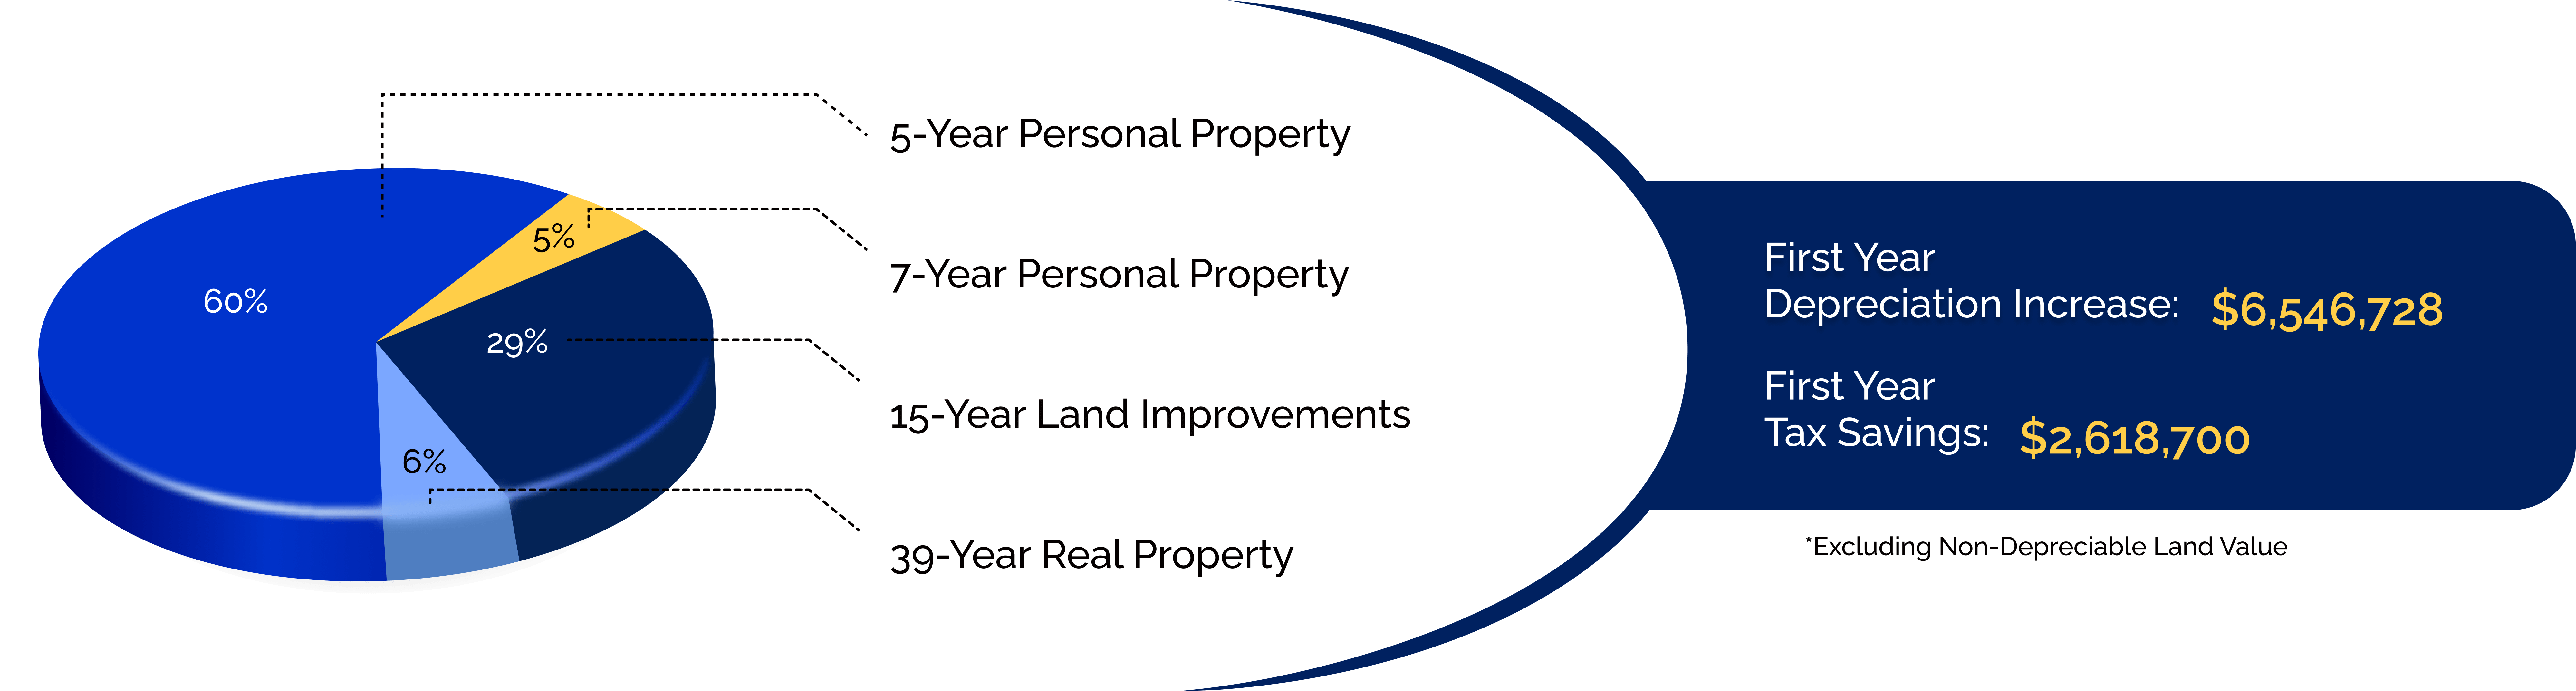
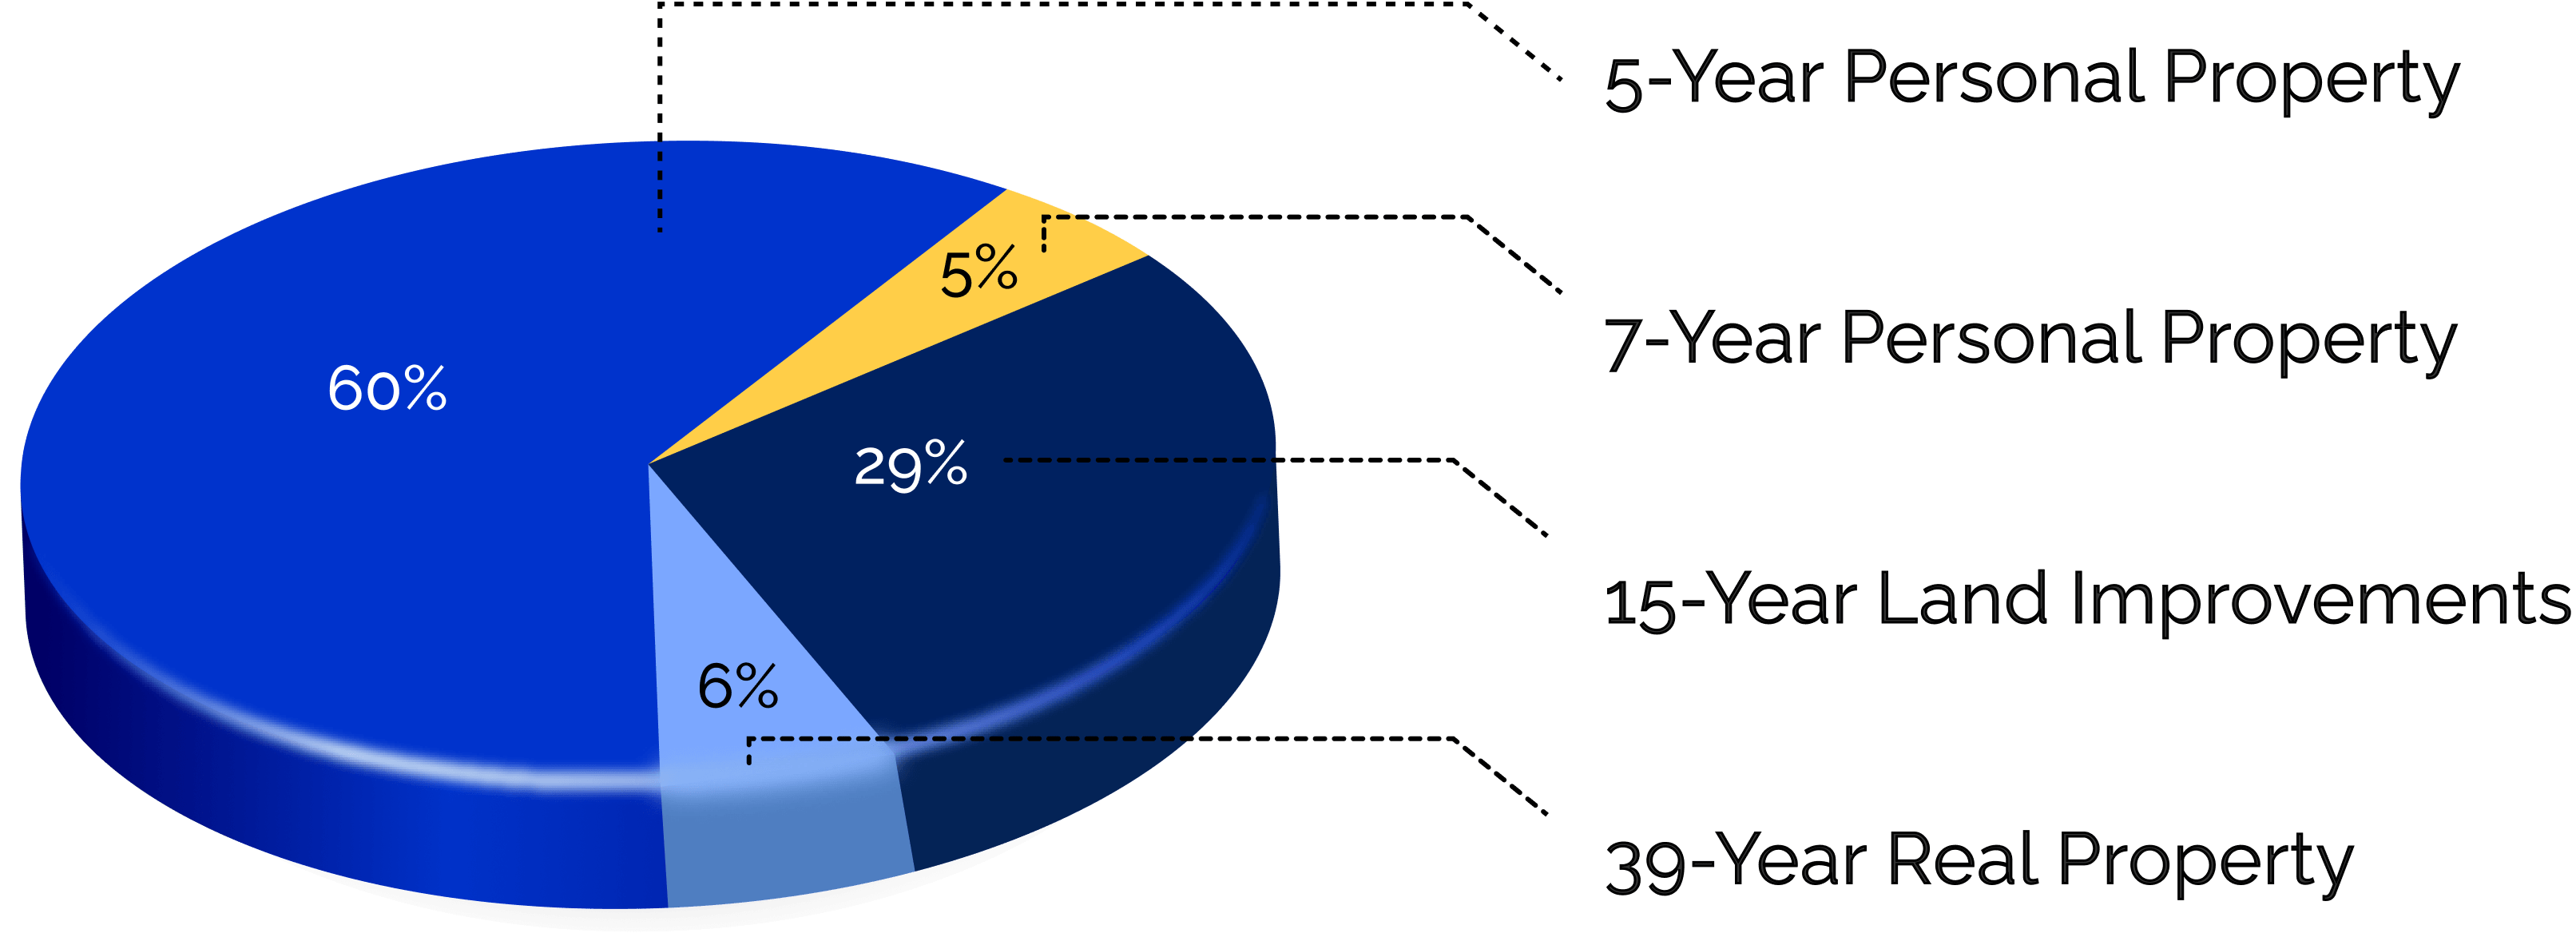
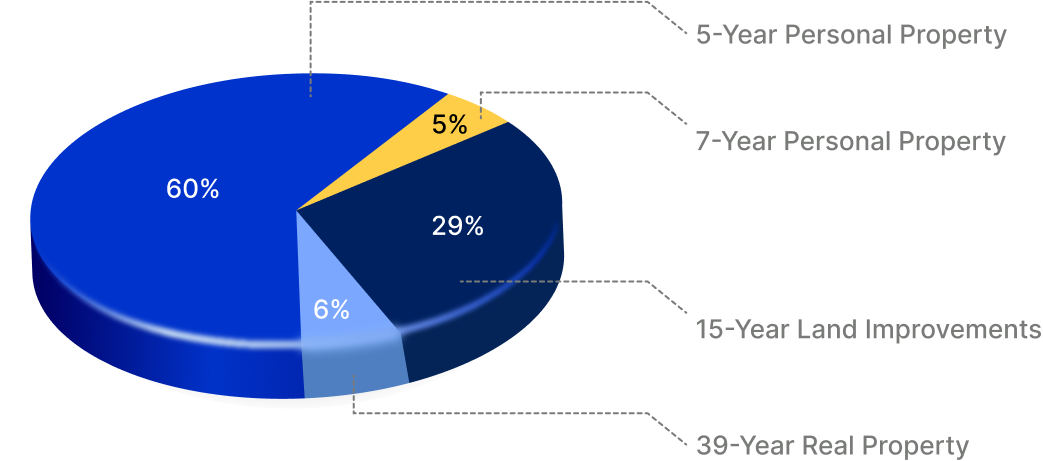
40% Property Reclassification Results
40% Property Reclassification
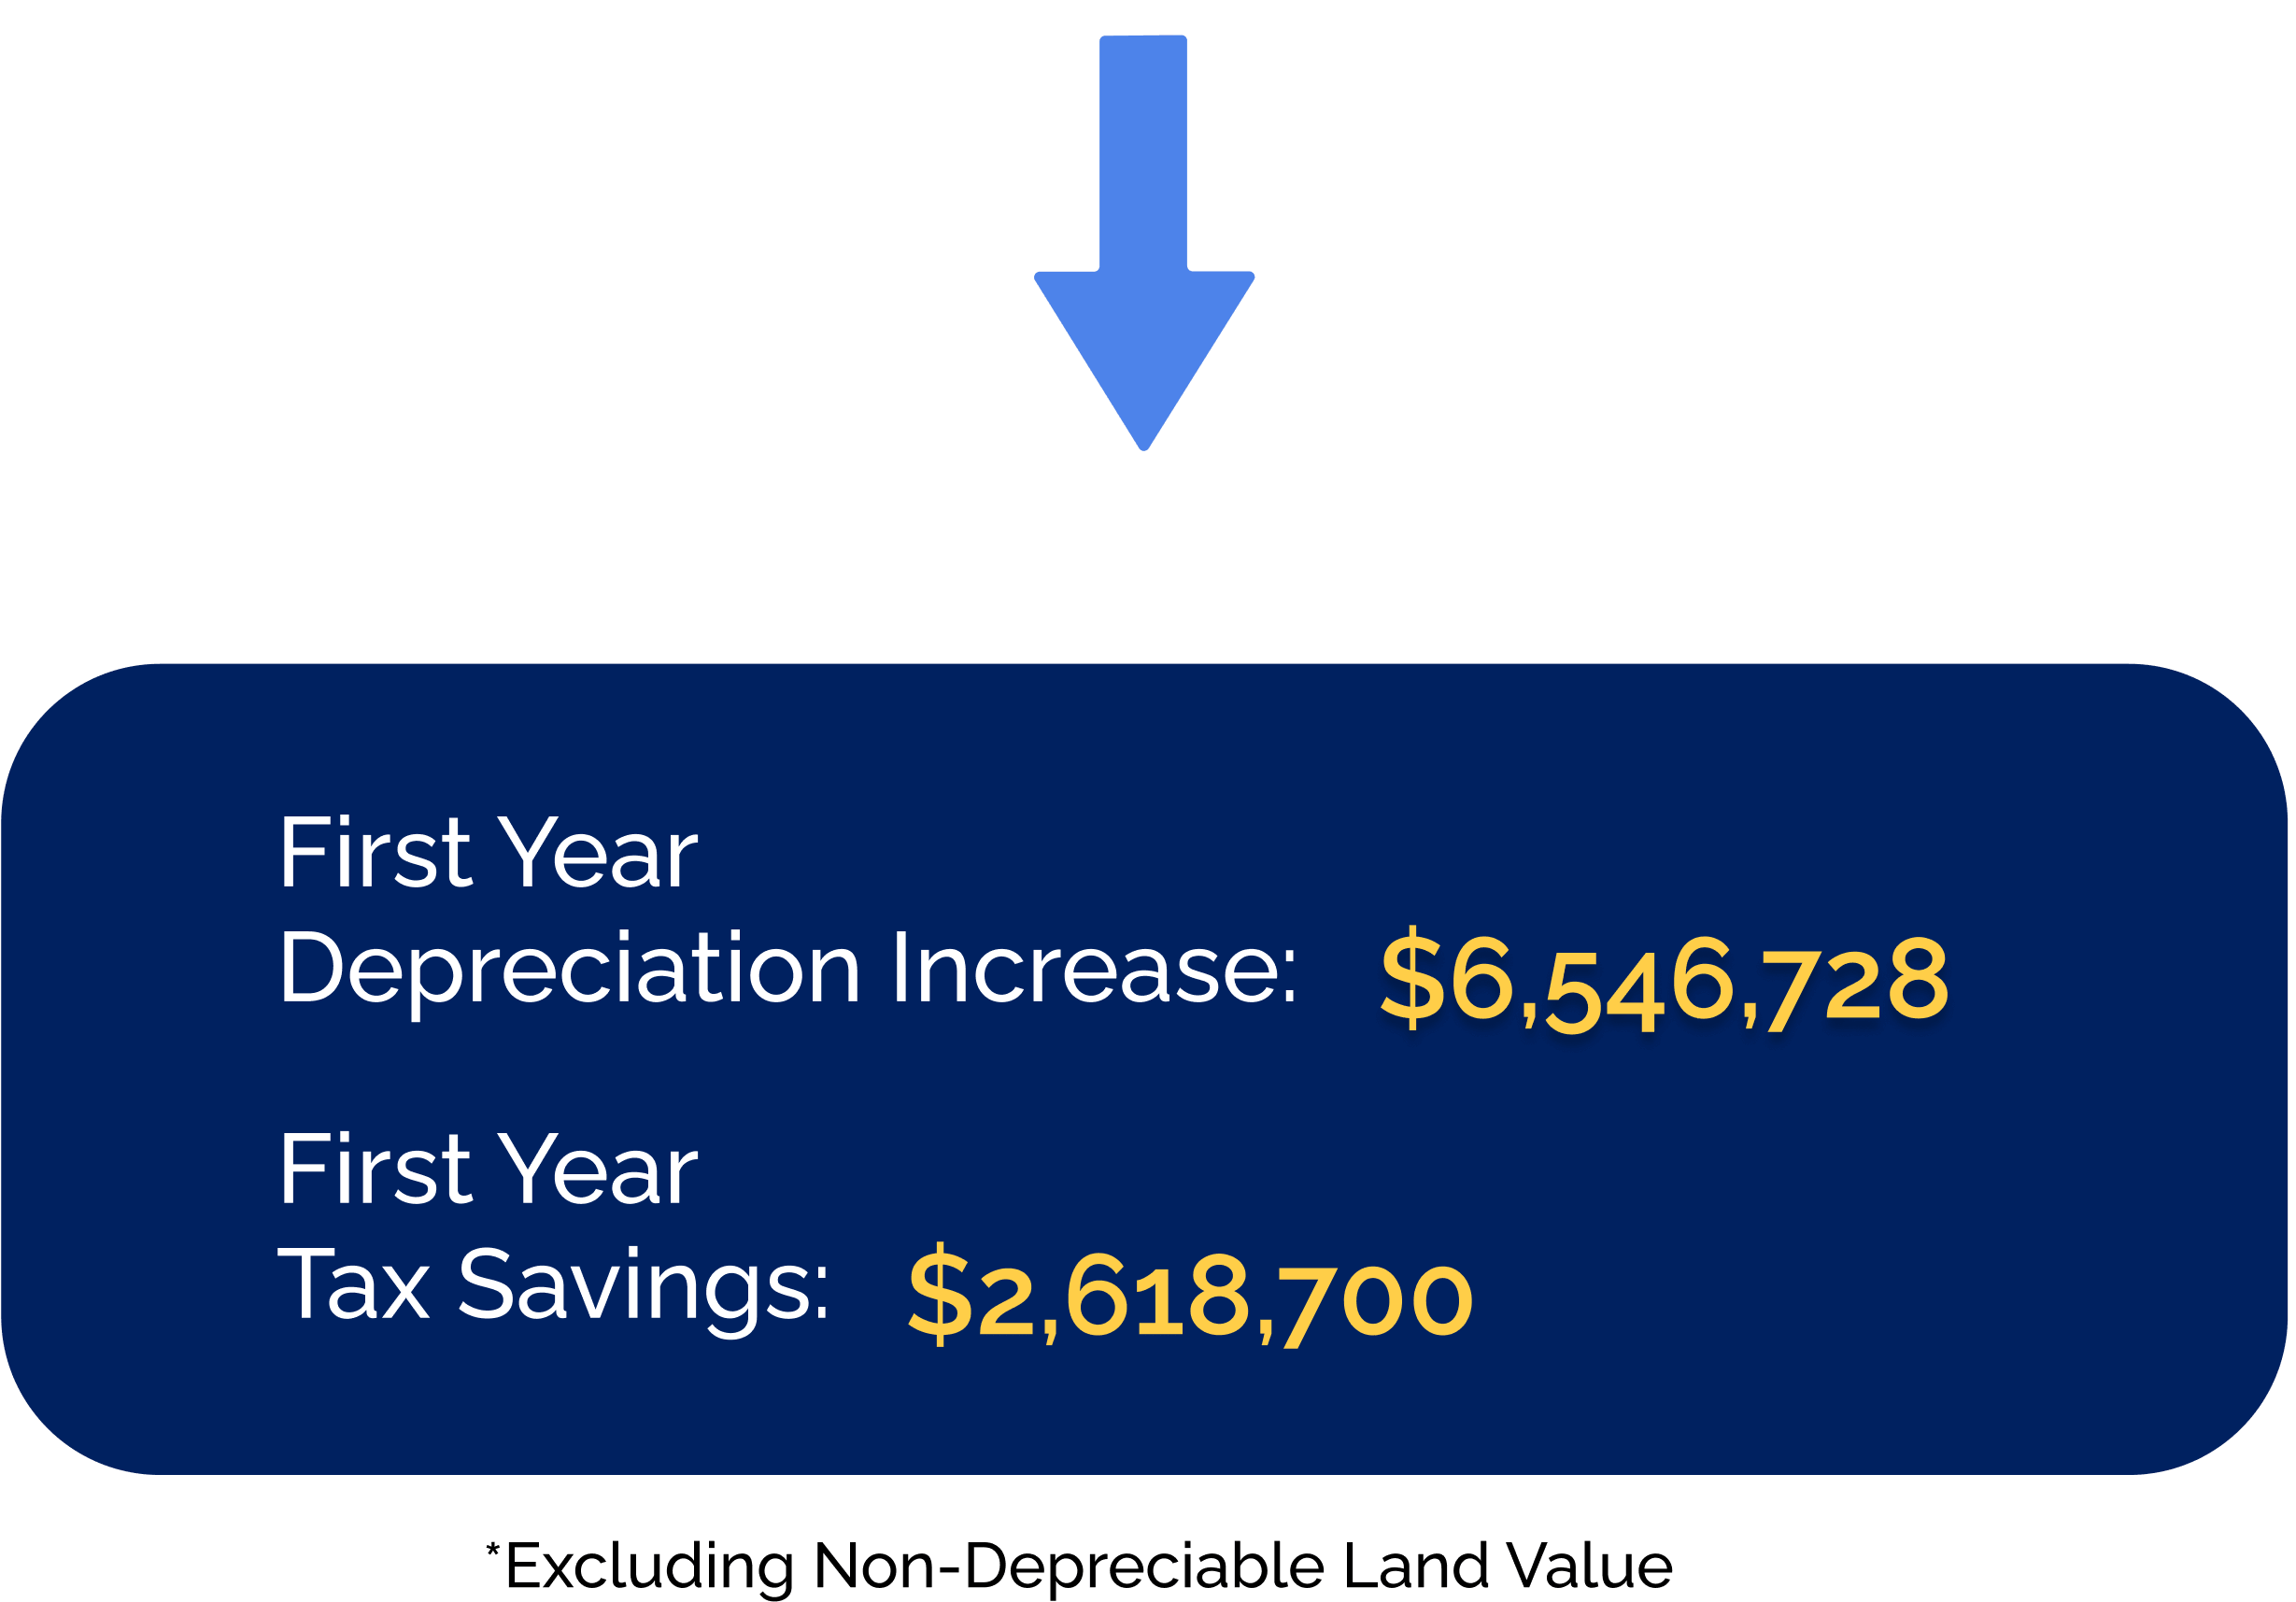
Results
First Year Depreciation Increase - $ 6,546,728
First Year Tax Savings - $2,618,700
*Excluding Non-Depreciable Land Value
*Excluding Non-Depreciable Land Value
Results
First Year Depreciation Increase - $ 6,546,728
First Year Tax Savings - $2,618,700
*Excluding Non-Depreciable Land Value
5-Year Personal Property Assets ($737,000)
Restaurant and bar equipment
Custom millwork for seating, countertops, shelving, and bar
IT equipment
Telephone and data wiring
Electrical and plumbing systems for kitchen appliances
Trench and floor drains
7-Year Personal Property Assets ($4,673,000)
Electric go-karts
Movable go-kart racing track system
Raised concrete track platform
Go-kart charging stations
Trampoline / ninja course equipment
Dedicated gaming area electric receptacles
Interior and exterior building signage
Furniture and fixtures
Fiberglass reinforced wall covering
Carpet
Resilient vinyl plank flooring
15-Year Land Improvement Assets ($1,002,000)
Asphalt parking lot and striping
Concrete paving and sidewalks
Stormwater management drainage
Site lighting
Additional Benefits
100% bonus depreciation was available for the 2019 tax year.
This study was one of three entertainment facilities the client entrusted CRS to complete; other locations are in Connecticut and central New Jersey.